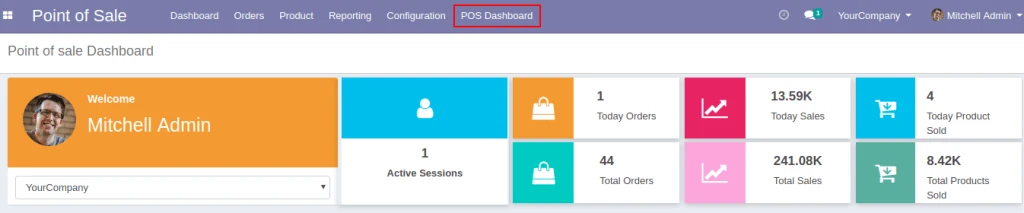
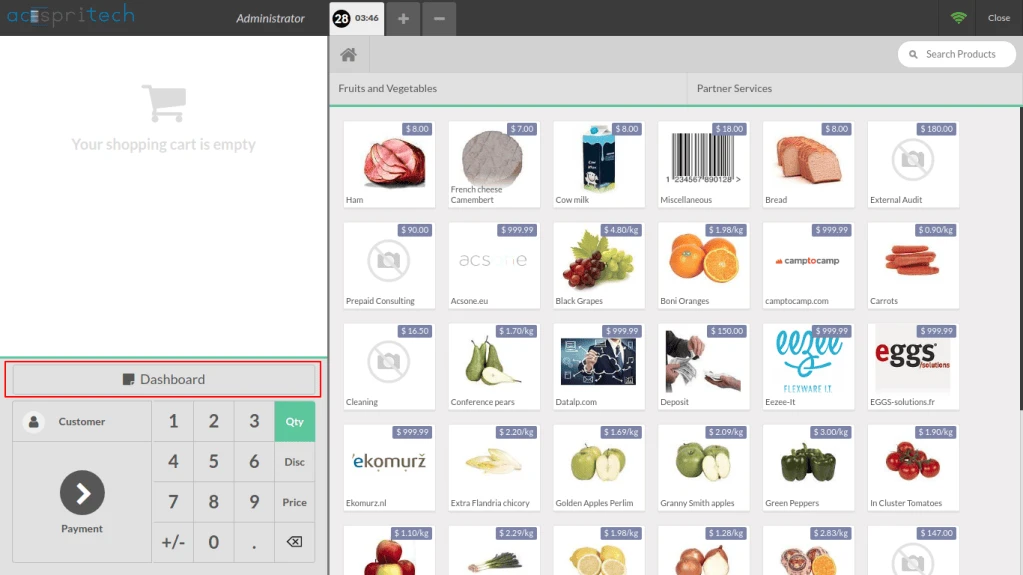
Click on the POS Dashboard in Point of Sale Menu to Open.
POS Backend Dashboard
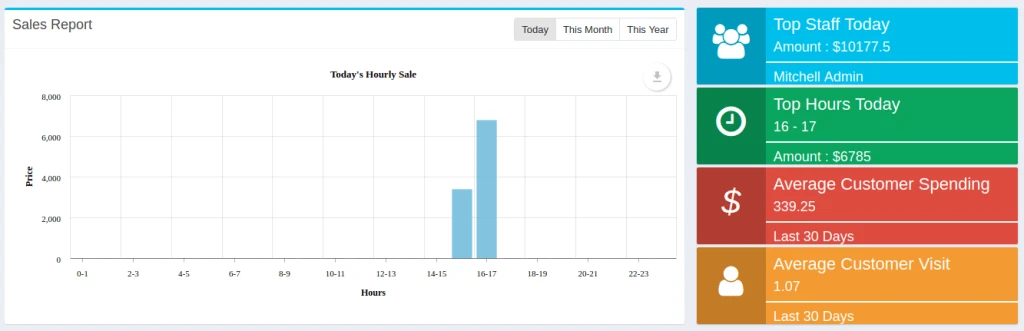
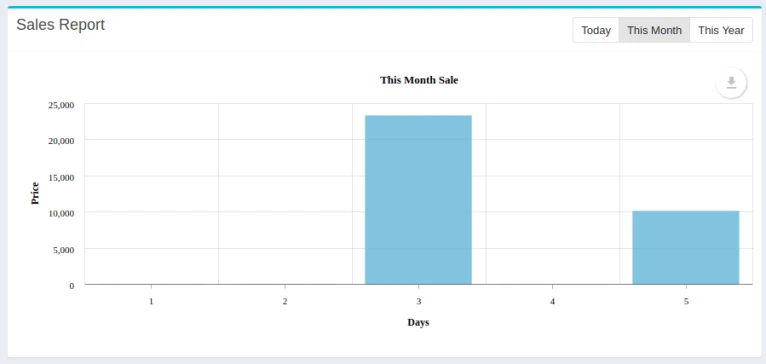
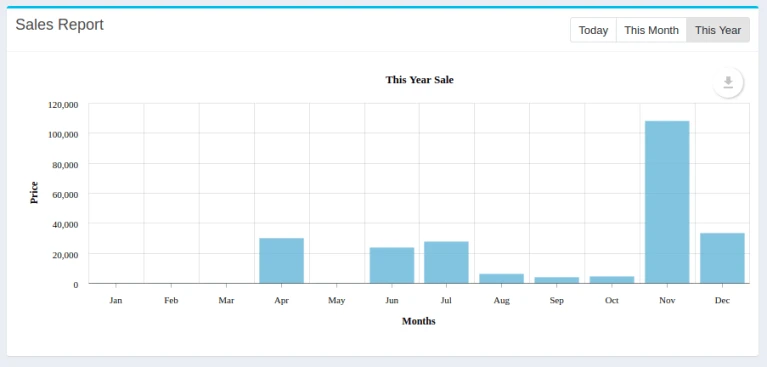
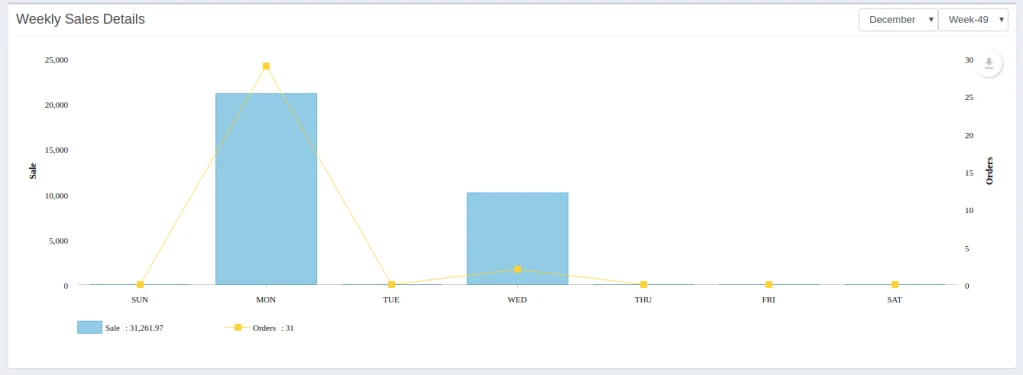
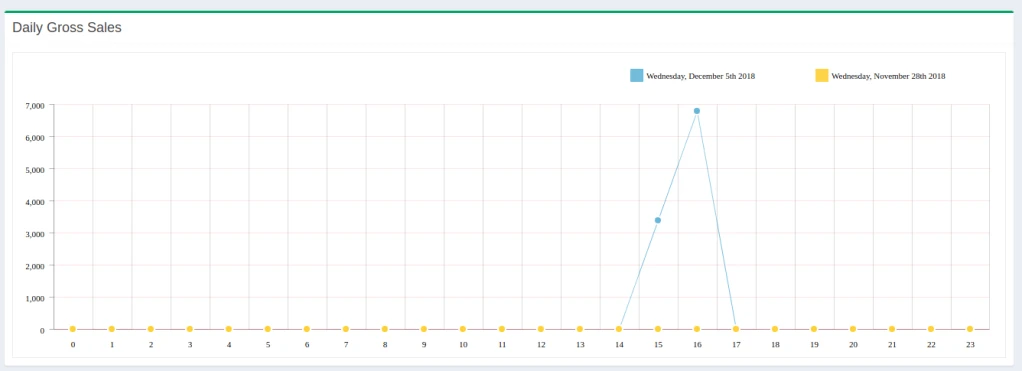
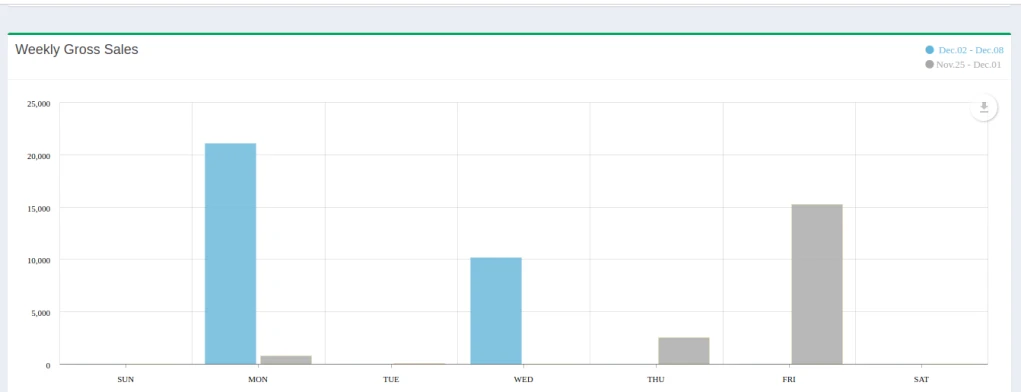
Here, user can see sales according to different filter like Today, Monthly or Yearly.
This display Salesperson name who sold highest today, Hours in which highest sales
Average Customer Spending and Visit as per last 30 days.
This module allow to analyze pos sales details based on various aspect.
User friendly graphical as well tabular data representation.
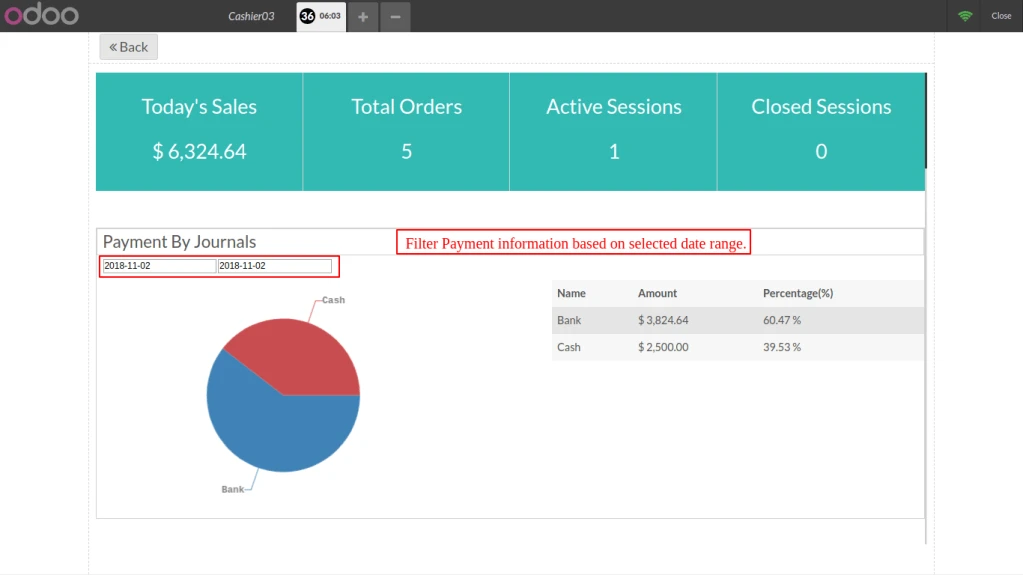
User can easily get information about total number of orders, total sales
amount,active/closed sessions at the very first view of dashboard.
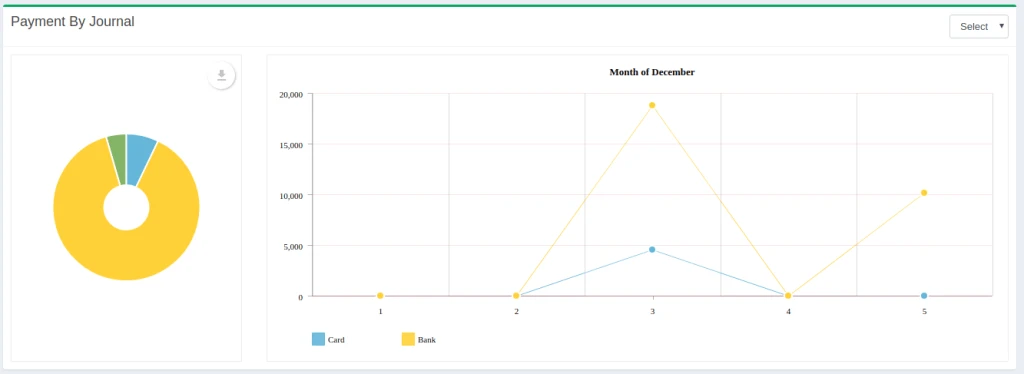
Analysis based on payment methods.
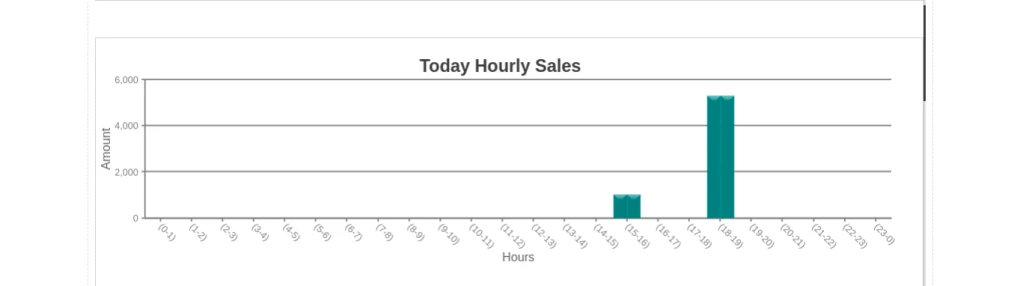
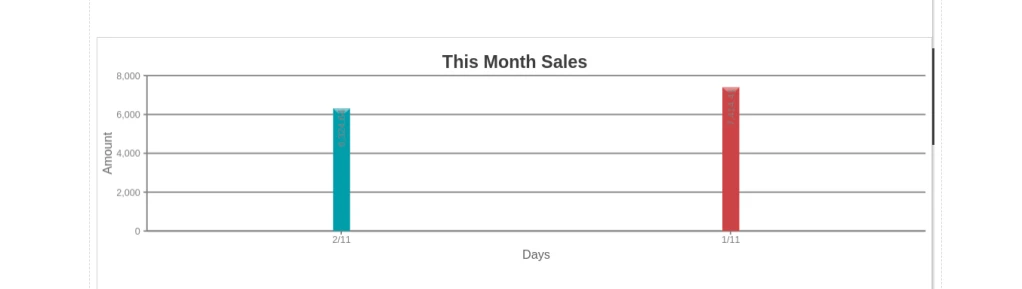
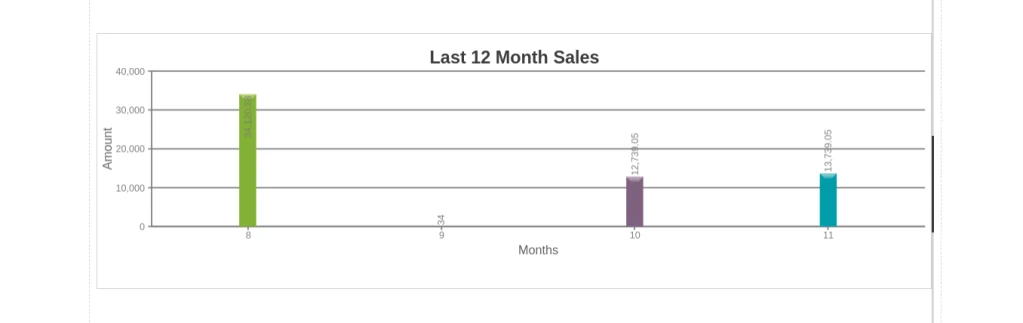
User can check hourly sale as well month days sales and 12 month sales
amount of pos orders.
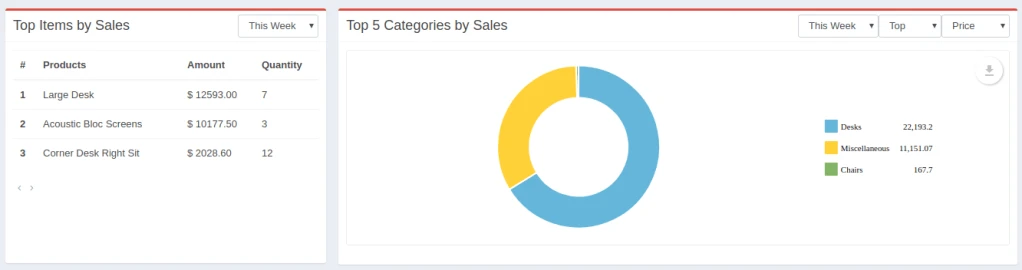
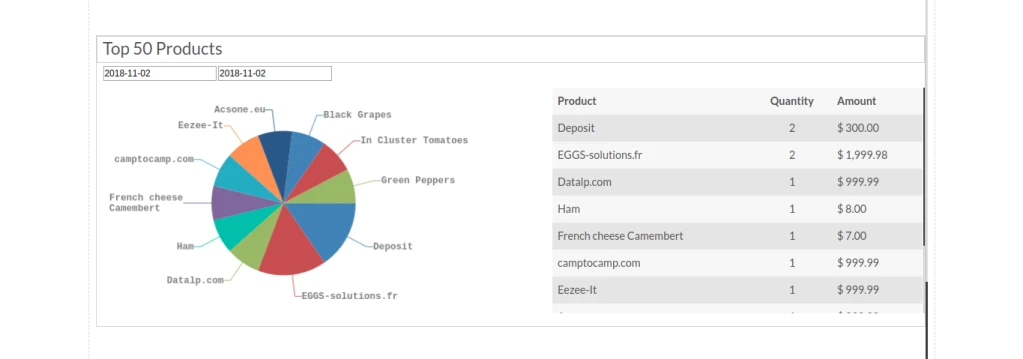
Pie chart and tabular format of top 50 products of the day based on
date range.
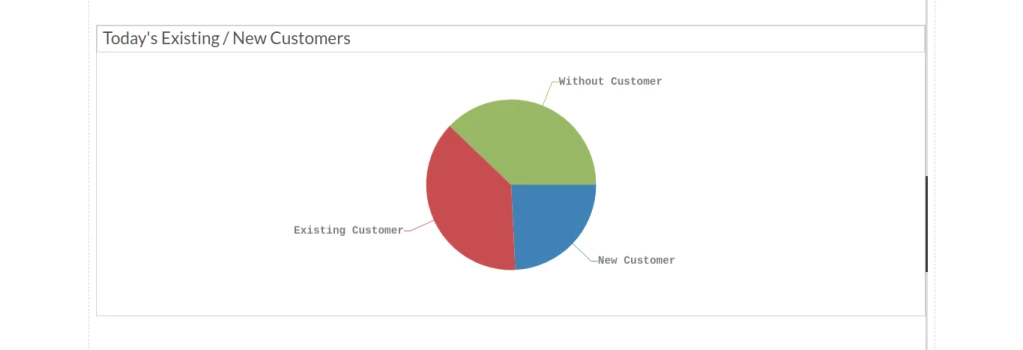
Analysis based Incomming customer type like customer is Exsting/New who
purchased orders with us and how much order are created without customer
means with guest customer.
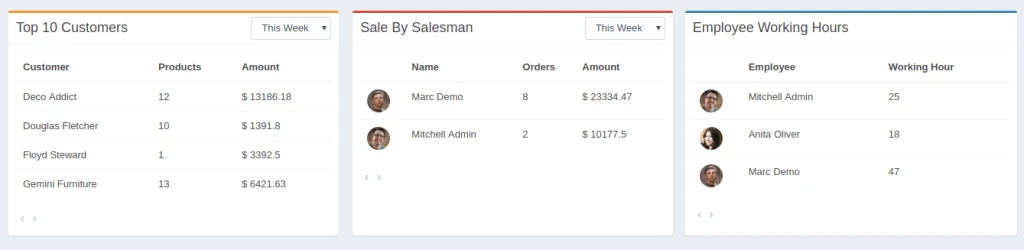
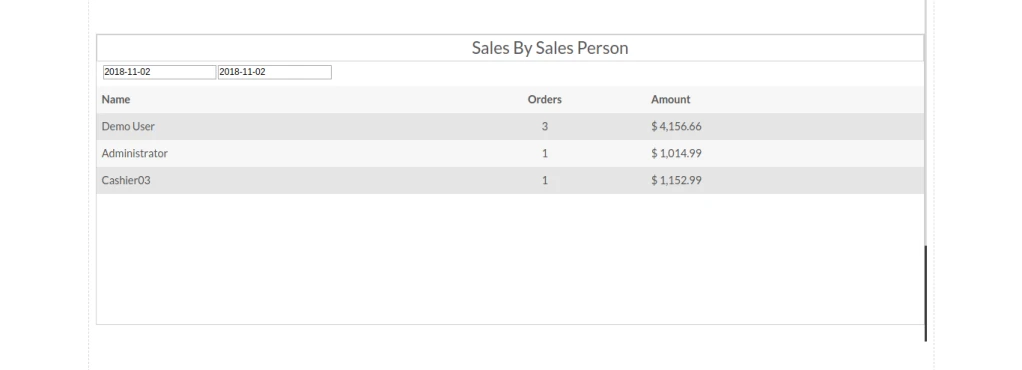
POS sales data based on cashier how much order they created and how much
amount of order they have sale.
How to use
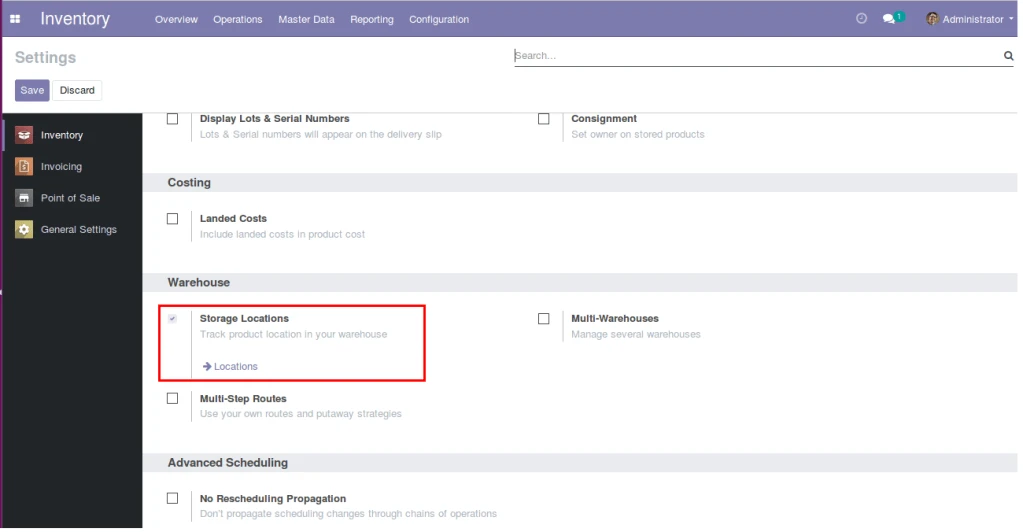
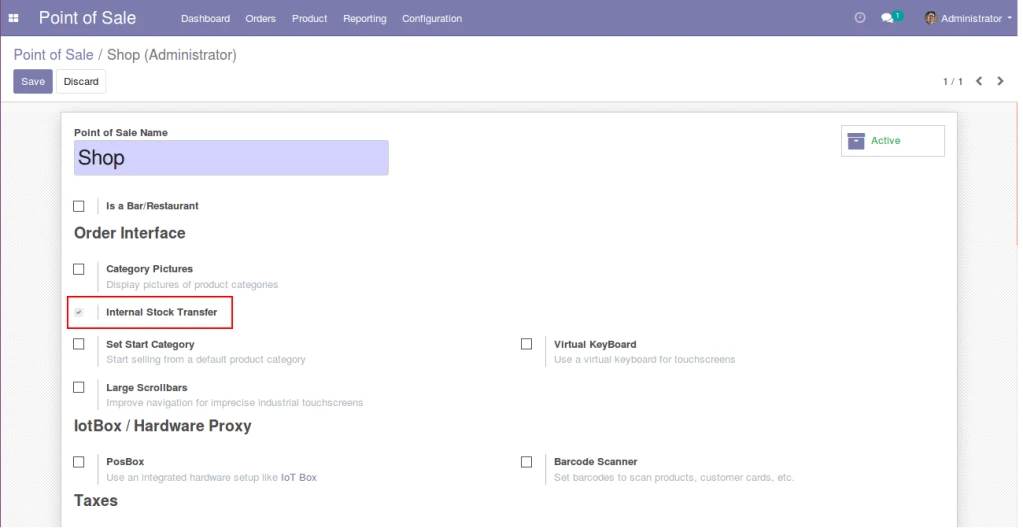
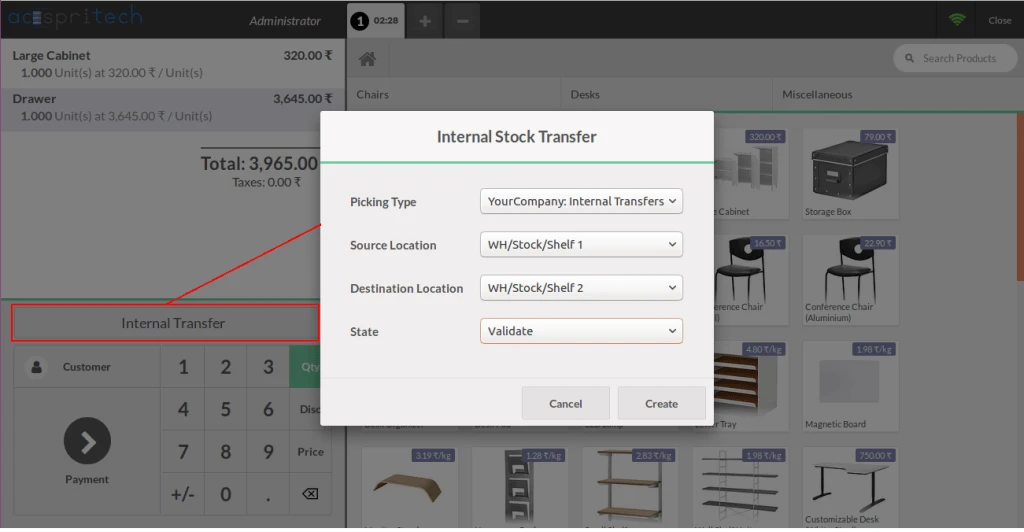
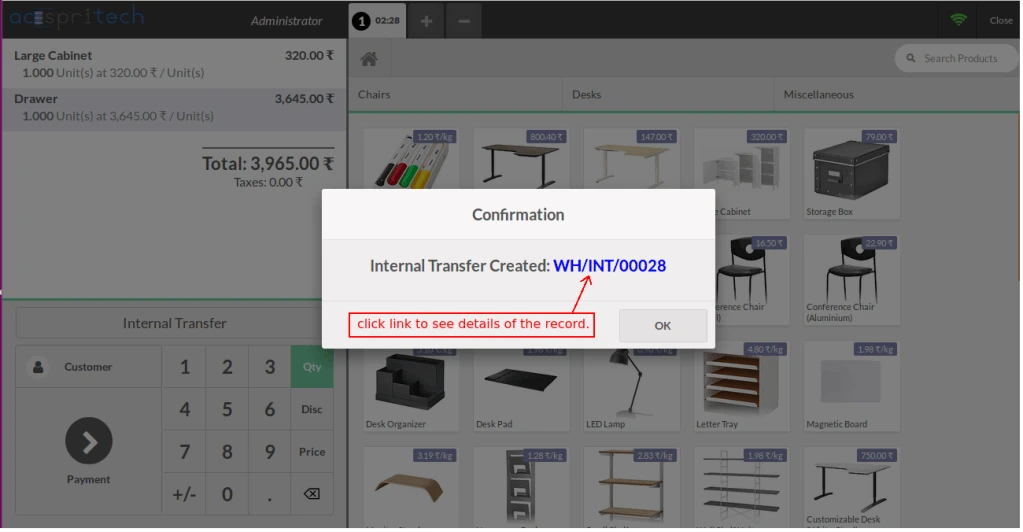
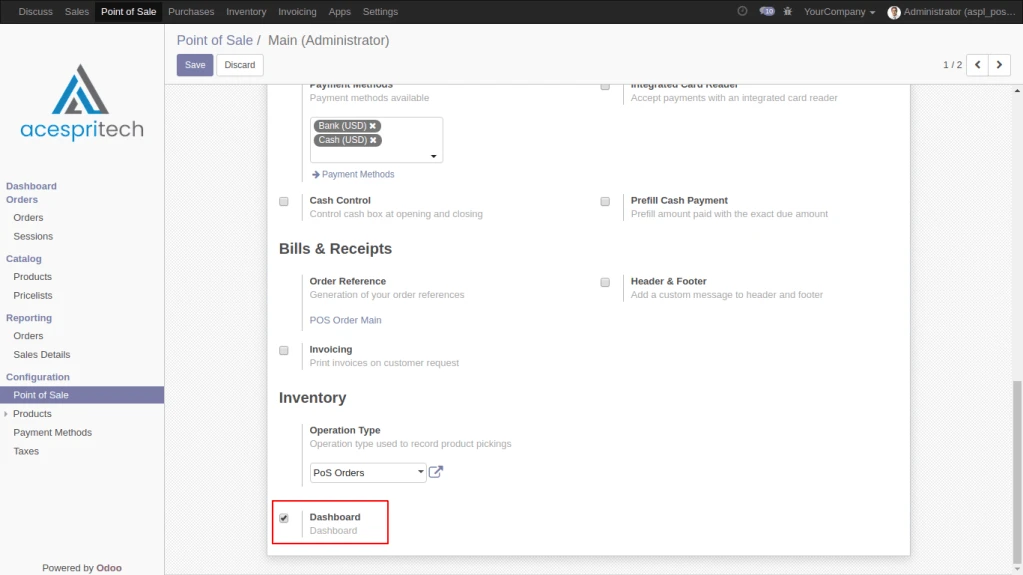
For active this feature in point of sale, User need to enable this configuration
as shown in screenshot.
POS Configuration Sale Dashboard
After enable configuaration button will display, By click on this button user
can go to dashboard screen.
POS Dashboard ButtonPOS Payment InformationToday Hourly SaleCurrent Month SaleYearly SaleTop Fifty ProductsSales Based on Customer